15 Cruise Ports Most Likely to Be Missed or Canceled
Some cruise ports really are missed more often than others, but I do not want to fake precision.
Every percentage below comes from a published schedule, completed-call count, cancellation count, or reported landing-success rate, with the period and math shown. This is a ranked list of 15 destinations with traceable evidence, not a standardized global league table.
My quick take
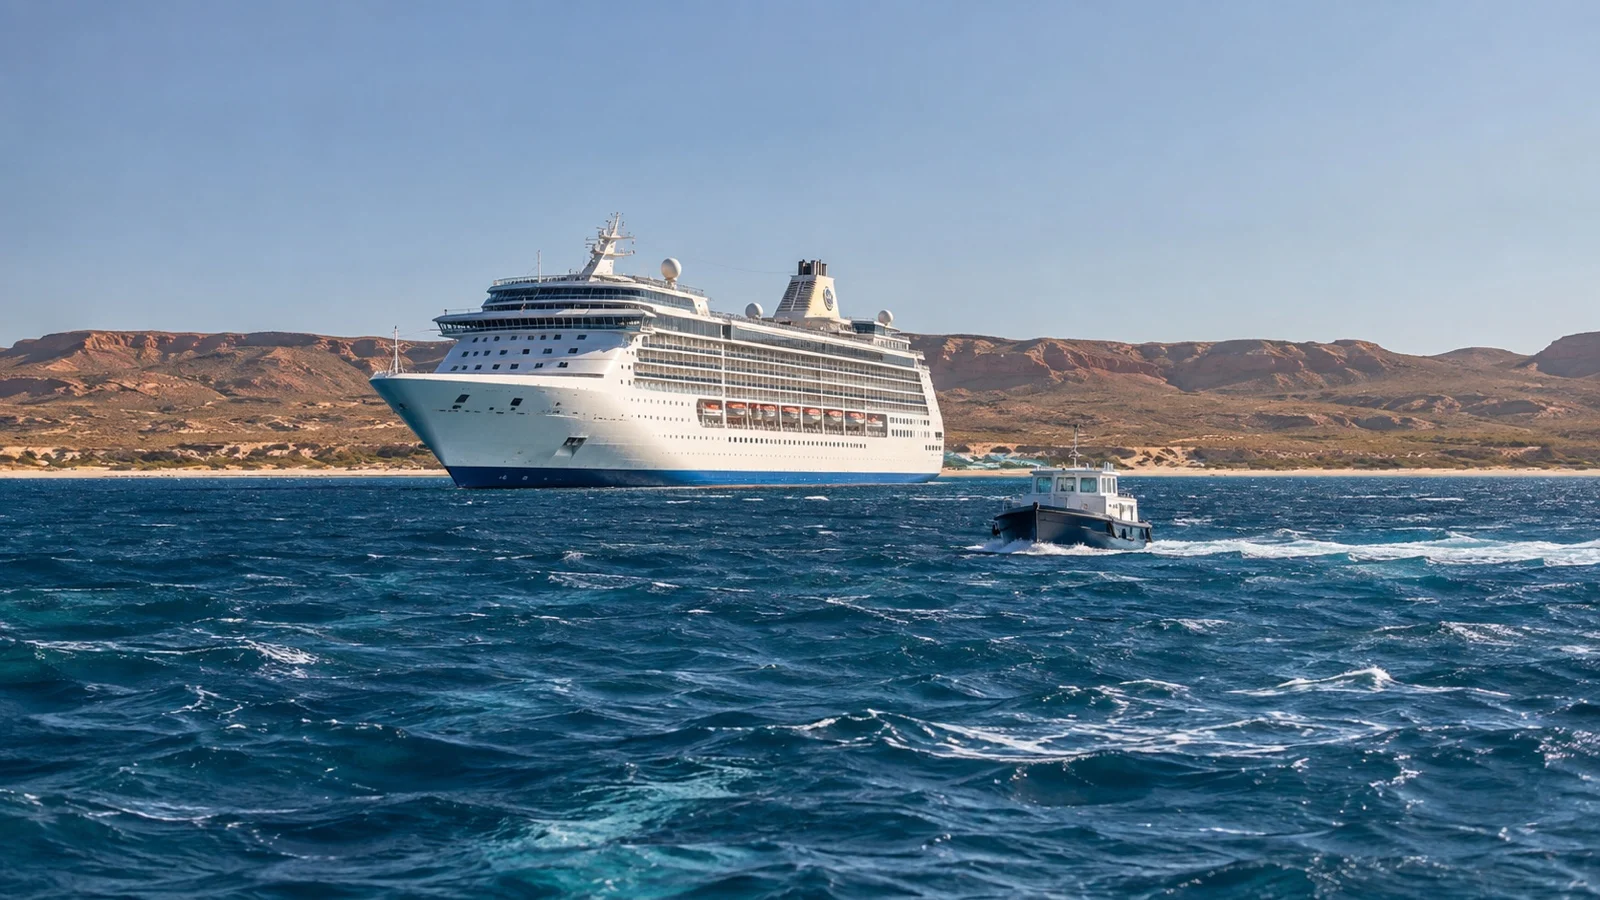
The most fragile port days tend to share the same ingredients: exposed water, tender transfers, limited landing infrastructure, or weather that can change faster than the itinerary. That does not mean you should avoid them.
It means I would never make a nonrefundable excursion the only acceptable version of the day. If tendering is new to you, start with what a tender port actually means.
The quick facts
- Highest documented figure here: Exmouth, about 50% of scheduled cruise visits across the seven years through 2019.
- Highest recent exact rate: Kaikōura, 40% of five planned calls canceled last summer.
- Biggest recurring issue: Tendering in exposed water.
- Best protection: Refundable excursions and realistic expectations.
How to read these percentages
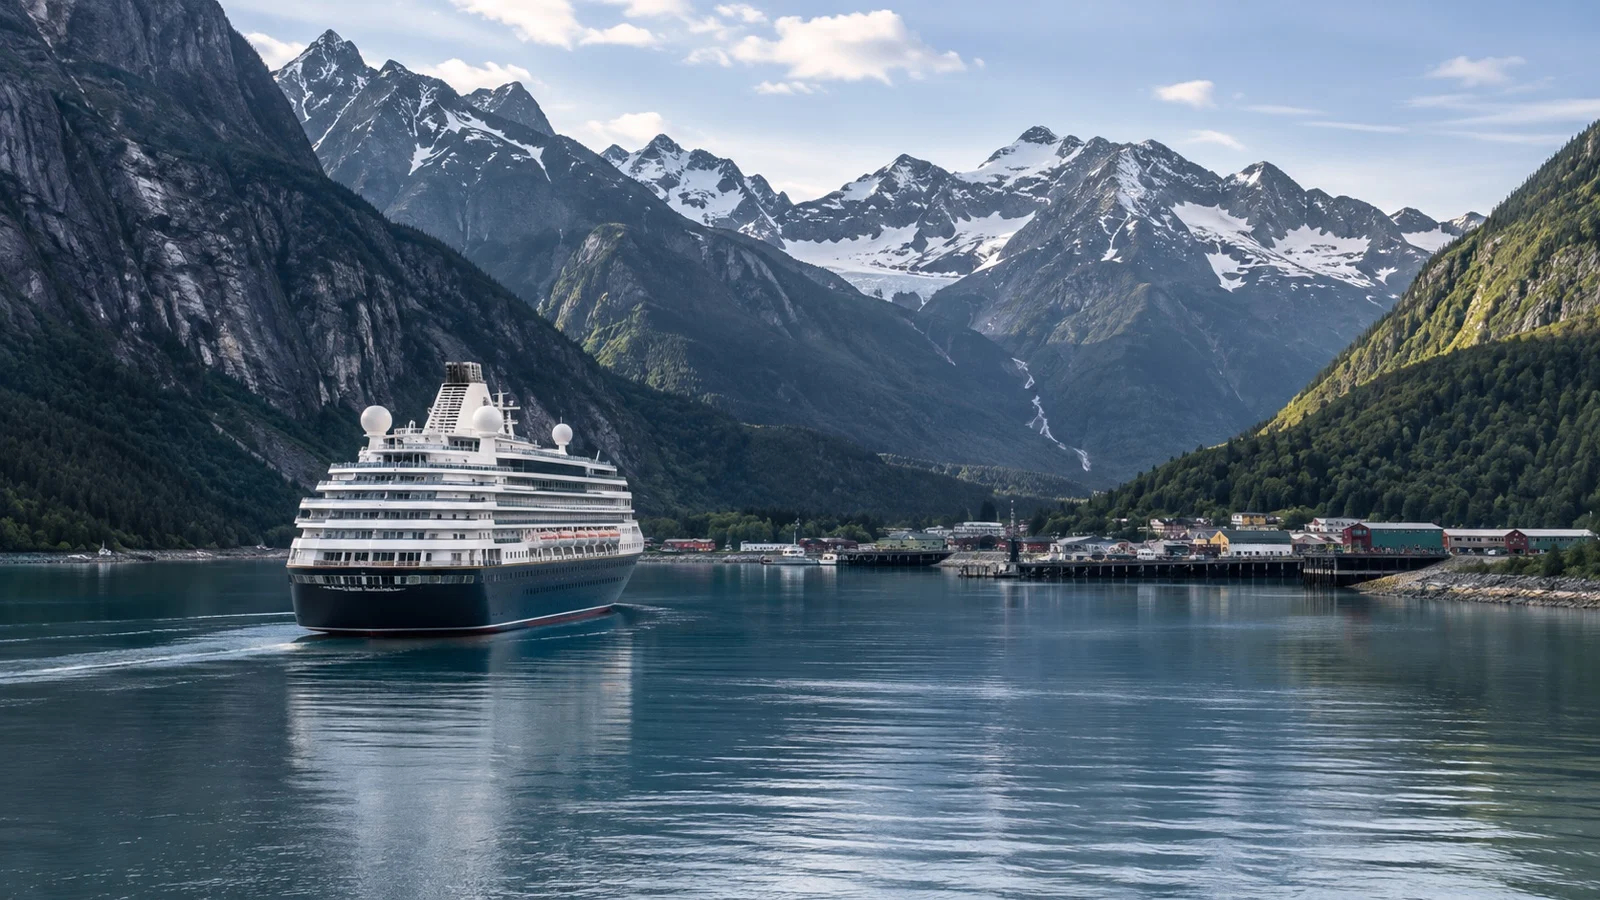
There is no standardized worldwide database that publishes one cancellation percentage for every cruise port. Different ports report different things, so I am labeling the measurement instead of pretending all 15 figures are identical.
A canceled-call rate means the ship did not make the planned call. A failed-landing rate can include a ship reaching the destination but passengers being unable to get ashore.
A schedule-to-actual shortfall compares calls originally scheduled with calls that ultimately happened. That gap can include weather, itinerary changes, technical problems, and other causes unless the source says otherwise.
1. Exmouth, Western Australia: about 50%
What the percentage means: Half of scheduled cruise visits were aborted across the seven years through 2019, according to a Government of Western Australia regional development report.
The Gascoyne Development Commission report says most cruise vessels anchored in Exmouth Gulf and tendered passengers to Exmouth Boat Harbour. It attributes the exposure to high winds, challenging tides, and the need for suitable open-water anchoring conditions.
This is not the same thing as saying half of ships never reached Exmouth waters. It is more useful to a cruiser anyway, because it measures whether the planned day ashore actually happened.
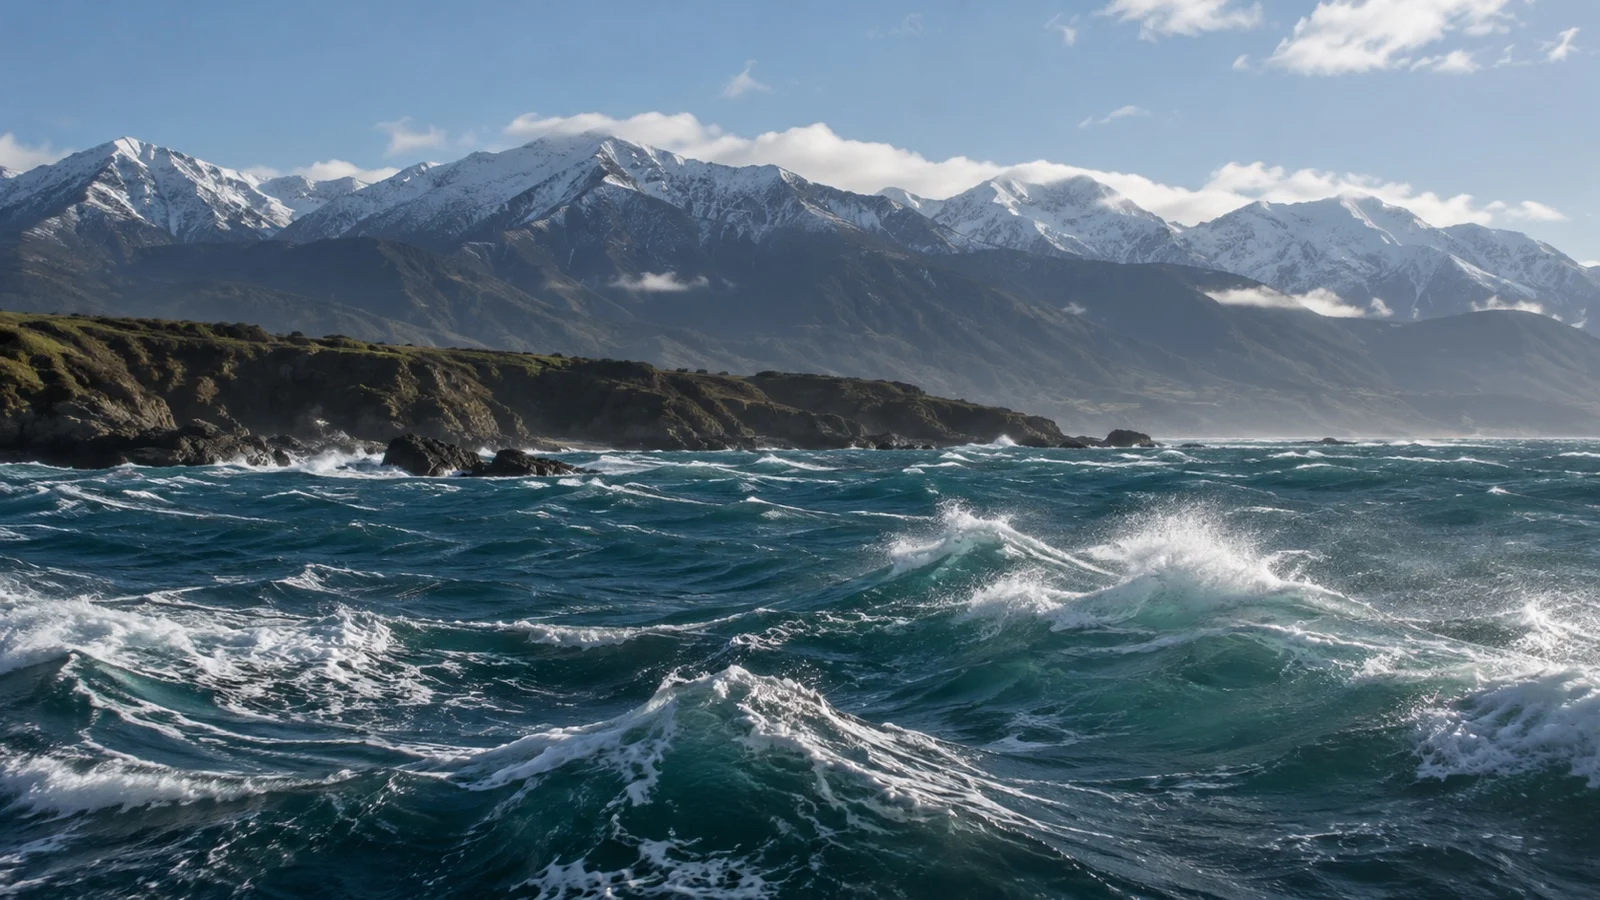
2. Kaikōura, New Zealand: 40%
What the percentage means: Two of five planned cruise visits were canceled by weather in the 2025-26 summer season. That is 2 ÷ 5, or 40%.
A July 2026 Local Democracy Reporting story quoted local officials saying five ships were due the previous summer and two were canceled because of weather. Kaikōura is an anchorage-and-tender call, so sea state matters enormously.
The sample is tiny, which is exactly why I would not tell you your personal cancellation odds are 40%. It does show how rough one season can be at an exposed tender destination.
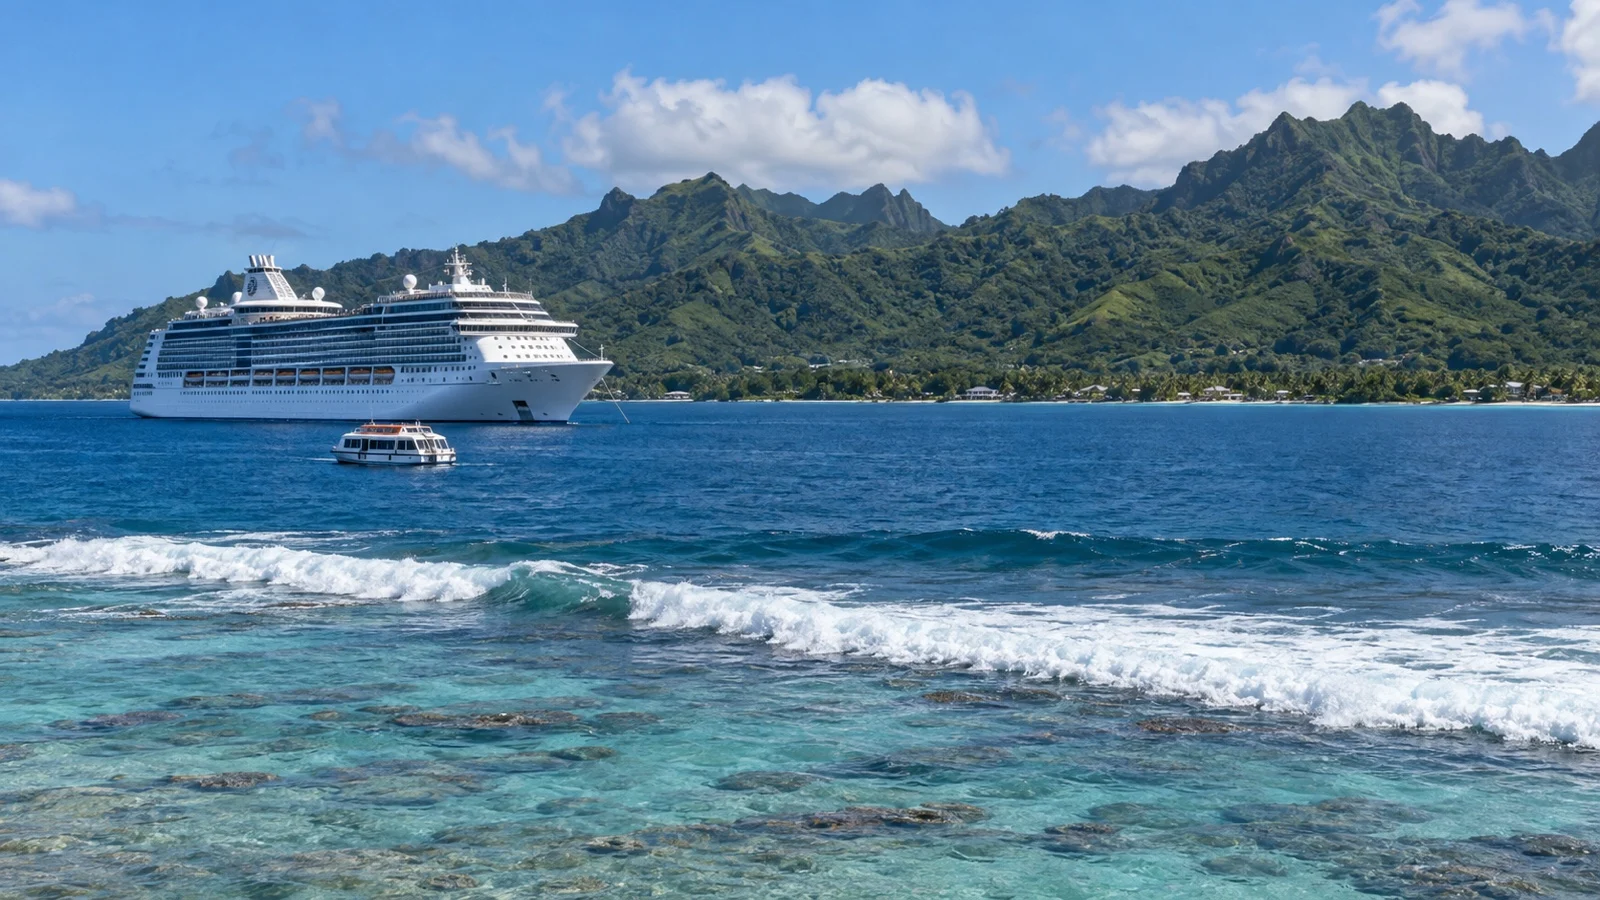
3. Rarotonga, Cook Islands: about 30% to 35%
What the percentage means: Cruise Cook Islands reported a 65% to 70% success rate for passenger landings in Rarotonga. The inverse is roughly 30% to 35% unsuccessful.
That figure was reported by Cook Islands News in late 2023, with strong winds identified as the recurring problem. A separate 2023 report quoted a 70% recent-years success rate, which points to the same general range.
My Rarotonga cruise port guide explains the Avatiu tender setup. This is one of the clearest examples of a beautiful island where getting ashore is the uncertain part.
4. Norfolk Island, Australia: 31.7% historically
What the percentage means: From 1992 through 2013, 19 of 60 recorded cruise calls were unable to disembark passengers. That is 31.7%.
The figure comes from evidence submitted to the Australian Parliament, which attributes the failed landings to rough seas or excessive swell at both anchorages. It is historical, so I would never present 31.7% as your current forecast.
Norfolk still lacks a conventional large cruise berth, which is why the old data remains useful context. My Norfolk Island cruise guide covers the landing logistics in more detail.
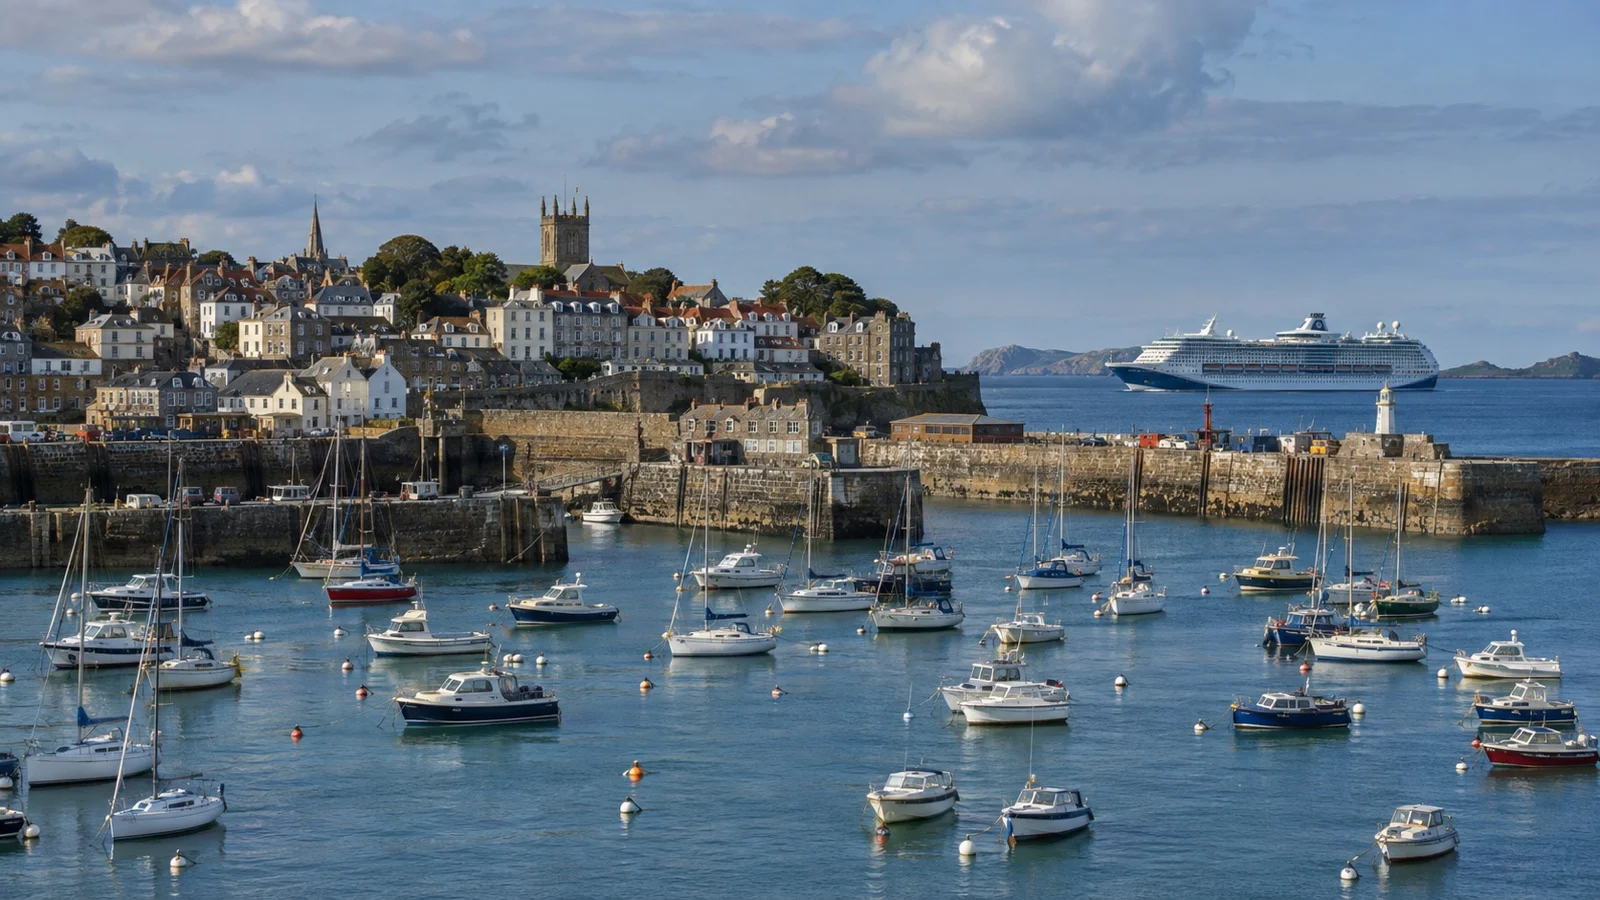
5. St. Peter Port, Guernsey: 24.2% in 2025
What the percentage means: Guernsey recorded 66 planned cruise visits and 50 actual visits in 2025. The official annual report says poor weather canceled 16 ships.
Sixteen weather cancellations out of 66 planned visits equals 24.2%. The numbers come directly from the Guernsey Travel and Visitor Annual Report 2025.
This is one of my favorite data points because the numerator, denominator, year, and cause are all explicit. It is also a reminder that an established European cruise destination can still lose nearly one in four planned calls in a rough year.
6. Kangaroo Island, Australia: 19.4% schedule-to-actual gap
What the percentage means: South Australia announced 31 Penneshaw cruise visits scheduled for 2023-24, while the final season data recorded 25 visits. The difference is six calls.
Six divided by 31 is 19.4%. The scheduled figure came from Tourism South Australia, and its final season infographic recorded 25 Kangaroo Island visits.
I call this a schedule-to-actual gap rather than a weather cancellation rate because the published sources do not assign a cause to all six missing calls. That distinction matters.
7. Isle of Man: 17.5% canceled in 2025
What the percentage means: Visit Isle of Man reports 47 successful cruise calls in 2025 and 10 cancellations for weather, technical issues, and other reasons.
That gives 57 known planned calls, with 10 canceled. The resulting all-cause cancellation rate is 17.5%, based on the official Visit Isle of Man annual passenger data.
The island uses several landing locations, so this is destination-wide rather than a Douglas-only percentage. I would treat it as an Isle of Man itinerary-risk figure, not a statistic for one berth.
8. Tórshavn, Faroe Islands: 16.1% in 2025
What the percentage means: Tórshavn received 47 cruise ships in 2025 and recorded nine weather-related cancellations. That implies 56 intended calls.
Nine divided by 56 is 16.1%. The season summary was published by Blue Faroe Islands using Port of Tórshavn season information.
The Faroes are exactly where I expect weather to matter even when a ship can berth. Wind, routing, and North Atlantic conditions can disrupt the call before passengers ever reach the gangway.
9. Gisborne, New Zealand: 12.5% documented cancellation share
What the percentage means: A regional cruise-development report said Gisborne had 21 calls forecast after three recent cancellations. That implies 24 bookings before those cancellations.
Three divided by 24 equals 12.5%. The figure appears in the Tairāwhiti Cruise Development Pathway.
This is a booking-cancellation share captured before the season was complete, not a weather-only miss rate. I include it because it is a clean example of how dramatically a small destination’s schedule can shift.
10. Eden, Australia: 12.5% in 2018-19
What the percentage means: Sixteen cruise ships were originally scheduled for Eden in the 2018-19 season, 14 visited, and two were canceled.
Two out of 16 is 12.5%. Those exact numbers appear in the Eden Killer Whale Museum 2018-19 annual report.
This is older data, and Eden has continued developing its cruise infrastructure since then. I use it as a documented historical season, not as a current 12.5% forecast.
11. Lerwick, Shetland: 12.4% schedule-to-actual gap in 2025
What the percentage means: Lerwick Port Authority began the 2025 season expecting 145 vessels and ended with 127 arrivals. That is an 18-call shortfall.
Eighteen divided by 145 is 12.4%. The Port Authority’s season-end report notes occasional North Sea weather disruptions, but it does not say weather caused every missing call.
That is why I am calling this a schedule-to-actual gap. It is still useful for itinerary planning because the cruiser’s question is simple: did the planned Lerwick day happen?
12. Bermuda: 8.9% canceled in 2024
What the percentage means: Bermuda began 2024 with 190 scheduled calls and finished with 173 actual calls. Seventeen were canceled.
Seventeen out of 190 is 8.9%. Bermuda’s official parliamentary record says 13 of those cancellations were weather-related and four were itinerary changes.
If you isolate weather alone, 13 out of 190 is 6.8%. I prefer showing both numbers because they answer two different questions.
13. Bay of Islands, New Zealand: 5.4% in 2023-24
What the percentage means: Ninety-two visits were booked for the 2023-24 season and 87 ships arrived. Five planned calls did not happen.
Five divided by 92 is 5.4%. A 2025 Bay of Islands case study reports those figures and says non-arrivals were usually weather-related.
That is much lower than Rarotonga, which is a useful reminder that not every tender destination belongs in the same risk bucket. Protected geography matters.
14. Aitutaki, Cook Islands: about 5%
What the percentage means: Cruise Cook Islands reported a 95% passenger-landing success rate at Aitutaki. The inverse is about 5% unsuccessful.
The figure was quoted by Cook Islands News alongside Rarotonga’s much lower 65% to 70% success rate. Aitutaki’s Arutanga landing is more sheltered, which helps explain the gap.
This is an industry-reported success estimate rather than an audited schedule table. I am comfortable using it because the source tells us exactly what it measures and who supplied it.
15. Skagway, Alaska: 3.3% canceled in 2024
What the percentage means: Skagway planned 515 cruise calls in 2024 and recorded 498. The municipality documented 17 cancellations.
Seventeen divided by 515 is 3.3%. The Municipality of Skagway’s 2024 season report says 11 cancellations were wind-related, with the others tied to dock work, mechanical trouble, or a no-show.
The wind-only rate was 2.1%, or 11 out of 515. My Skagway cruise port guide has the port layout and White Pass planning details.
Why I would not turn these percentages into personal odds
A 24.2% Guernsey rate in 2025 does not mean your 2027 Guernsey cruise has a 24.2% chance of cancellation. Weather patterns, ship size, berth arrangements, schedules, and infrastructure change from year to year.
The sample sizes also vary wildly. Kaikōura’s 40% came from only five planned visits, while Skagway’s 3.3% came from 515 planned calls.
The percentages are useful because they prove that missed calls are not evenly distributed. They are not useful as a promise about a future sailing.
What I would do differently at a higher-risk port
- Book refundable tours: I want a full refund if the ship cannot call.
- Read the cancellation wording: “Nonrefundable” is a bad fit for an exposed tender port.
- Keep a backup plan: I never let one missed port ruin the whole trip.
- Watch ship messages: Tender and weather decisions can change quickly.
- Protect return time: Rough conditions can also slow the trip back.
For a separate look at the timing side of port days, I use my guide to how early to return to your cruise ship. Cancellation risk and return-time risk are different problems, but both reward a little margin.
Should you avoid these ports?
No. Some of the ports on this list are here precisely because they are remote, exposed, and difficult to reach, which is also what makes them memorable.
I would happily book Rarotonga, Norfolk Island, Guernsey, Shetland, or Kaikōura. I would just avoid making one weather-sensitive call the only reason I chose the entire cruise.
Final word
The useful question is not “Will my port be canceled?” Nobody can answer that months in advance with a trustworthy percentage.
The better question is “Has this destination shown real cancellation or failed-landing exposure before?” For these 15, the answer is yes, and now you can see the actual evidence behind the claim.
How this guide was researched: Every percentage above was checked against the linked source and recalculated where a numerator and denominator were available. Rates use different periods and measurement types, so they are historical evidence rather than standardized forecasts.
Details were reviewed in September 2026. See our Editorial Policy.
More on this topic: browse every guide on port logistics and timing.